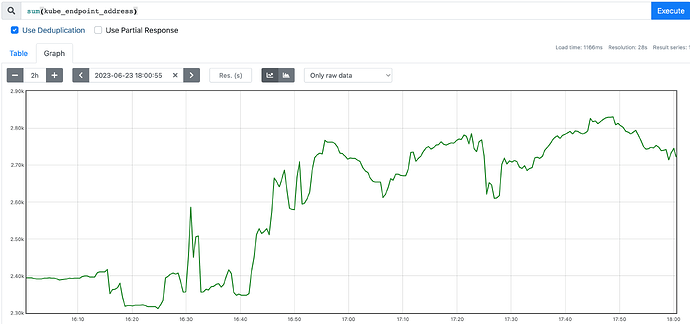
We believe it is stale IPs (or, at least, IPs that should not be routed to according to the SMI TrafficSplit we have setup) for a few reasons.
For one thing, this event tends to occur after we have completed a rollout of a canaried set of pods. During the canary, there will be two sets of pods running: one with the new code (within its own service that is a leaf of the trafficsplit which has the original service that is being routed to: api-canary) and one with the old code (similar to the canary, this is the stable set of pods; api-stable). When the rollout finishes, traffic is stable, and the selectors for the stable service (api-stable) will be changed to mirror that of the canary (api-canary) because the changes have been promoted.
What we are seeing with linkerd is that, after the changes to the services have been made and linkerd should just be routing to the stable (newly promoted from canary) set of pods, it instead exhibits weird behavior where it will send traffic to the pods that were in the canary set (even after they are deleted).
During the TrafficSplit changes, something odd happens according to the metrics where traffic is all routed to a single pod, and then they are routed back to a set of pods that was just deleted, causing the proxies that are sending traffic to those pods to go into failfast, and only recover once the destination control plane recovers:
In the image above, you can see that the traffic gets shifted to the canary set (though, only one pod for some reason), and then progressively more traffic goes onto this single pod until it is determined that the canary set is good enough to become the new stable set. Then, once we have swapped to the new stable set (our old canary set of pods) we find that we are sending traffic to the replicaset of 85f7886bb6 instead of 778986fff9 (the canary set that was for some reason only routing to a single set of pods). This is worsened by the fact that these pods were in the process of being deleted! So, while traffic was successful for a small amount of time, it quickly failed, causing the linkerd proxies that were sending traffic to these pods to go into fail fast and then never update with the new endpoints that should point to the new stable set (778986fff9) until the destination control plane is restarted.
IMO, the set of endpoints 778986fff9 is stale, since we have swapped the selectors on the service to a different set of pods, and those pods are being deleted. For some reason they were never pruned or updated from the client pod’s linkerd proxy point of view, so traffic continued to be sent to them until the destination controller was restarted (which I assume, reset any stale caches or refreshed all the information that the linkerd proxies stream in on the client pods).


